addChart

- addBarcode
- addBibliography
- addBookmark
- addBreak
- addCaption
- addChart
- addCitation
- addComment
- addCrossReference
- addDateAndHour
- addEndnote
- addExternalFile
- addFootnote
- addFormElement
- addHeading
- addImage
- addIndex
- addLink
- addList
- addMathEquation
- addMergeField
- addOLE
- addOnlineVideo
- addPageNumber
- addRuby
- addShape
- addSimpleField
- addSource
- addStructuredDocumentTag
- addSVG
- addTab
- addTable
- addTableAuthorities
- addTableContents
- addTableFigures
- addText
- addTextBox
- addWordFragment
- addWordML
- embedHTML
- markEntry
- addBackgroundImage
- addFooter
- addFooterSection
- addHeader
- addHeaderSection
- addLineNumbering
- addMacroFromDoc
- addPageBorders
- addProperties
- addSection
- createDocx
- createDocxAndDownload
- createCharacterStyle
- createListStyle
- createParagraphStyle
- createTableStyle
- docxSettings
- embedFont
- importChartStyle
- importHeadersAndFooters
- importListStyle
- importStyles
- importStylesWordDefault
- importTheme
- modifyPageLayout
- parseStyles
- removeFooters
- removeHeaders
- setBackgroundColor
- setDecimalSymbol
- setDefaultFont
- setDocumentDefaultStyles
- setEncodeUTF8
- setLanguage
- setMarkAsFinal
- setRTL
- clearBlocks
- cloneBlock
- deleteBlock
- getTemplateVariables
- getTemplateVariablesType
- modifyInputFields
- modifyMergeFields
- processTemplate
- removeTemplateVariable
- removeTemplateVariableImage
- replaceBlock
- replaceListVariable
- replacePlaceholderImage
- replaceTableVariable
- replaceVariableByExternalFile
- replaceVariableByHtml
- replaceVariableByText
- replaceVariableByWordFragment
- replaceVariableByWordML
- setTemplateSymbol
- setTemplateBlockSymbol
- tickCheckboxes

addChart
 TRIAL / ADVANCED / PREMIUM
Inserts a chart into a Word document.
This method allows the insertion of a chart into a Word document.
You may insert many different types of 2D and 3D charts:
- 2D:
- Bar (clustered, stacked and 100% stacked).
- Column (clustered, stacked and 100% stacked).
- Pie (simple, exploded, pie of pie and bar of pie).
- Doughnut.
- Line.
- Area.
- Surface.
- Radar.
- XY (scatter).
- Bubble.
- 3D:
- Bar: box (default), cylinder, cone, and pyramid (clustered, stacked and 100% stacked).
- Column: box (default), cylinder, cone, and pyramid (clustered, stacked and 100% stacked).
- Pie (simple and exploded).
- Surface.
- Line.
- Extended charts (not supported by all DOCX readers):
- Box & whisker.
- Funnel.
- Histogram.
- Sunburst.
- Treemap.
- Waterfall.
This method also allows adding combo charts, trendlines, grids, labels and many other chart features.
Options
This is an array with the following possible keys and values:
| Key | Type | Description |
|---|---|---|
| data | array | This array should contain the legends and data and to be represented in the following format: 'data' => array( 'legend' => array('Series 1', 'Series 2', 'Series 3'), 'data' => array( array( 'name' => 'data 1', 'values' => array(10, 20, 30), ), array( 'name' => 'data 2', 'values' => array(20, 4, 5), ), array( 'name' => 'data 3', 'values' => array(10, 0, 2), ), ) ) You should omit the legend array in charts for which each data array only contains one value like, for example, pie charts. |
| type | String | The possible values are:
|
| title | string | The chart title. |
| border | string | Border width in points. |
| chartAlign | string | Chart alignment: left (default), right or center. |
| color | int | Word color scheme for charts:
|
| comboChart | string | Chart to add as a combo chart. Use with the returnChart option. Global styles and properties are shared with the base chart. For bar, col, line, area, and radar charts. |
| customStyle | string | Set external color and styles files imported using the importChartStyle method. |
| excludeExternalData | bool | If true, don't embed the XLSX into the DOCX. Default as false. |
| externalXLSX | array | Possible keys and values are:
|
| float | string | Floating chart: left, right or center. It only applies if textWrap is not inline (default value). |
| font | string | The font to be used. Arial, Calibri... |
| returnChart | bool | If true it returns the XML of the chart. To be used with the comboChart option. Default as false. |
| sizeX | int | The chart width in centimeters (default value ~ 8.5 cm). |
| sizeY | int | The chart height in centimeters (default value ~ 6.0 cm). |
| textWrap | int | The way text shoud wrap the chart. Possible values are (check the Word interface for the graphical explanation of the different terms):
|
| trendline | array | Adds trendlines. Compatible with line, bar, col and area 2D charts. Possible keys and values are:
|
Chart display properties
| Key | Type | Description |
|---|---|---|
| axPos | array | Position of the axis (r, l, t, b). Each value of the array for each position (if a value if null avoids adding it). |
| formatCode | string | Number format. |
| formatDataLabels | array | Possible keys and values are:
|
| haxLabel | string | Label for the horizontal axis. |
| haxLabelDisplay | bool | How to display the label of the horizontal axis. Possible values are: vertical, horizontal, rotated. |
| hgrid | int | Horizontal grid. Possible values are:
|
| horizontalOffset | int | Given in emus (1cm = 360000 emus). |
| majorUnit | float | Major unit value for bar, col, line, area, radar and scatter charts. |
| minorUnit | float | Minor unit value for bar, col, line, area, radar and scatter charts. |
| orientation | array | Orientation of the axis, from min to max (minMax) or max to min (maxMin). Each value of the array for each axis (if a value if null avoids adding it). |
| scalingMax | float | Scaling max value for bar, col, line, area, radar and scatter charts. |
| scalingMin | float | Scaling max value for bar, col, line, area, radar and scatter charts. |
| stylesTitle | array | Possible keys and values are:
|
| vaxLabel | string | Label for the vertical axis. |
| vaxLabelDisplay | bool | How to display the label of the horizontal axis. Possible values are: vertical, horizontal, rotated. |
| verticalOffset | int | Given in emus (1cm = 360000 emus). |
| vgrid | int | Vertical grid. Possible values are:
|
The available parameters to display legends and data include:
| Key | Type | Description |
|---|---|---|
| legendOverlay | bool | If true the legend may overlay the chart. This option may hinder the legibility of the data so it is only recommended if it is crucial to "save space". |
| legendPos | string | The possible values are:
|
| showCategory | bool | If true shows the categories inside the chart. |
| showLegendKey | bool | If true shows the legend values. |
| showPercent | bool | If true shows the percentage values. |
| showSeries | bool | If true shows the series values. |
| showTable | bool | If true shows the chart data in an associated table. |
| showValue | bool | If true shows the chart data values. |
Further configuration options for specific chart types are:
| Key | Type | Description |
|---|---|---|
| Bar and column charts | ||
| gapWidth | int | Gap width. |
| groupBar | string | Different ways to group data. Possible values are: clustered, stacked, percentStacked and standard. |
| overlap | int | Overlap. |
| tickLblPos | string or array | Tick label position: nextTo, high, low, none. If string, uses default values. If array, sets a value for each position |
| Pie and doughnut charts | ||
| explosion | int | Distance among different sectors. |
| holeSize | int | Size of the inner hole (only doughnut charts). |
| ofPieCharts: pie of pie and bar of pie charts | ||
| custSplit | array | Custom split. Array (zero based) of values that goes in the second chart. For example: array(3,4,7) will pick the fourth, fifth and eighth value. |
| gapWidth | int | Distance between the two charts. |
| secondPieSize | int | Percentage size of the auxiliary chart. |
| splitType | string | How to split the two charts. Possible values are:
|
| splitPos | int | Determines the threshold value to split the charts. |
| subtype | string | Defines if the auxiliary chart is a pie or bar chart. Possible values are pie or bar. |
| Line and scatter (XY) charts | ||
| smooth | mixed | If true it smooths the line. '0' forces disabling it |
| symbol | string | The possible symbol values are:
|
| symbolSize | int | The size of the symbol used. |
| Radar charts | ||
| deleteAxisValues | bool | If true remove the axis values. |
| style | string | Defines the radar chart style. Possible values are:
|
| Surface charts | ||
| wireframe | bool | If true the surface is shown as a wireframe. |
Additional available options for 3D charts:
| Key | Type | Description |
|---|---|---|
| perspective | int | Perspective angle. Angles beyond 25 degrees provoke a big distortion in the 3D chart representation. |
| rotX | int | Rotation angle with respect to the vertical axis. Standard values are between 10 and 20 degrees. |
| rotY | int | Rotation angle with respect to the horizontal axis. Standard values are between 10 and 20 degrees. |
Extended charts supported options:
| Key | Type | Description |
|---|---|---|
| chartAlign | string | Chart alignment: left (default), right or center. |
| color | string |
|
| legend | array | (data subarray) legends |
| legendPos | string |
|
| showLegend | bool | If true shows the legend values. |
| sizeX | int | The chart width in centimeters (default value ~ 8.5 cm). |
| sizeY | int | The chart height in centimeters (default value ~ 6.0 cm). |
| style | string |
|
| subtotals | array | (data subarray) subtotal indexes. Waterfall charts. |
| title | string | The chart title. |
Theme options (Available in Premium licenses):
| Key | Type | Description |
|---|---|---|
| chartArea | array | backgroundColor |
| gridLines | array |
|
| horizontalAxis | array |
|
| legendArea | array |
|
| plotArea | array | backgroundColor |
| serDataLabels | array |
|
| serMarkerOptions | array |
|
| serRgbColors | array | series colors |
| valueDataLabels | array |
|
| valueRgbColors | array | values colors |
| verticalAxis | array |
|
Chart to be added as combo chart.
No data, legends or values.
externalXLSX values are not valid.
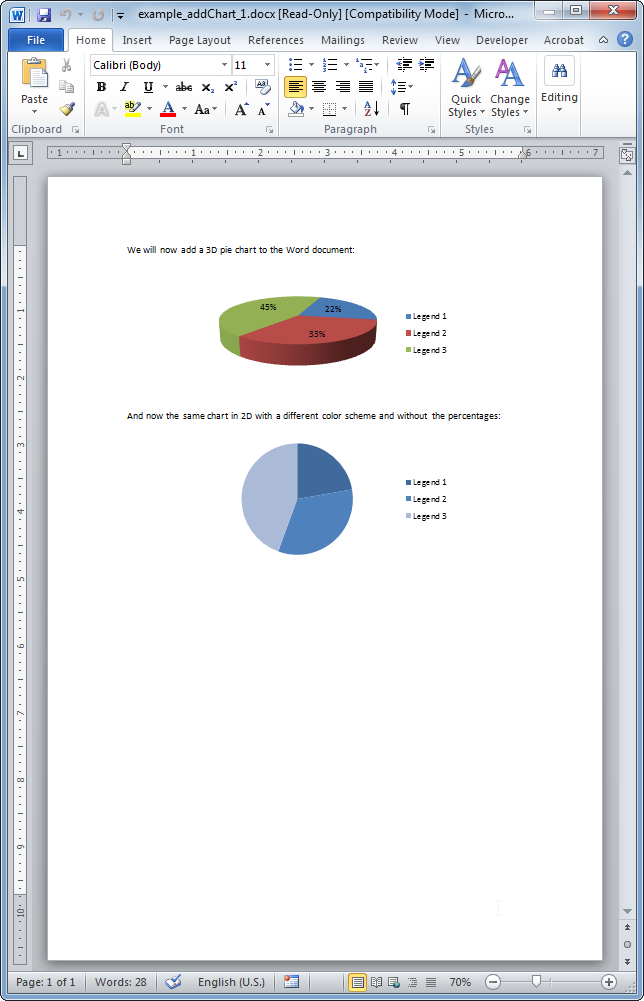
Example #1
The resulting Word document looks like:
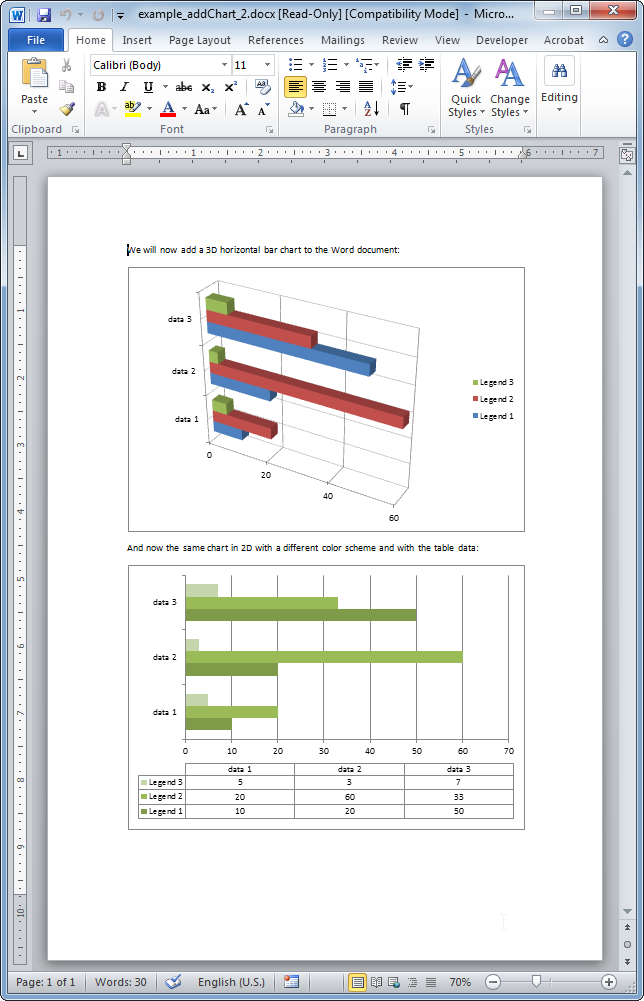
Example #2
The resulting Word document looks like:
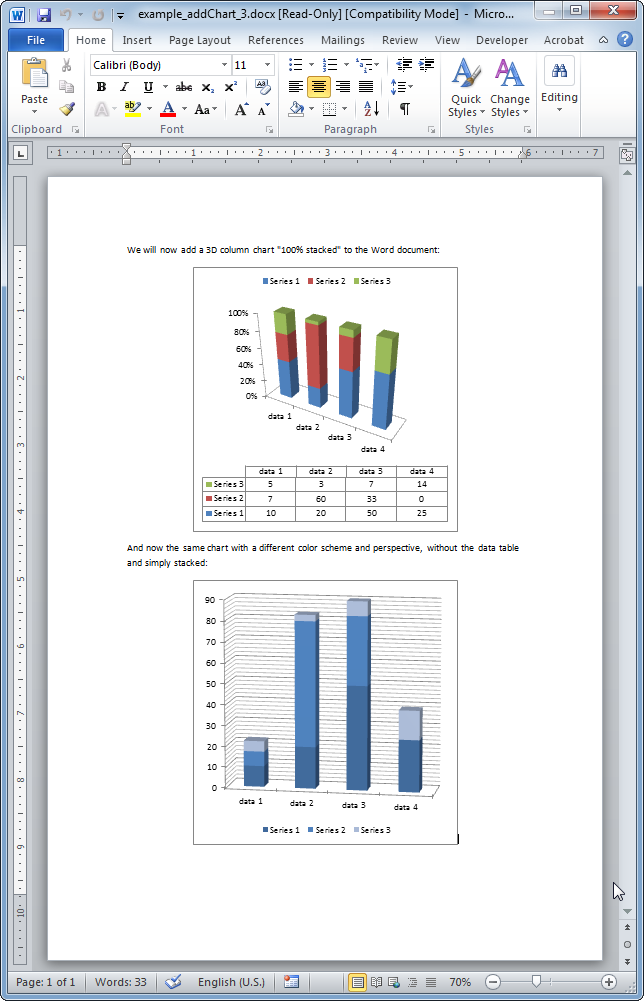
Example #3
The resulting Word document looks like:
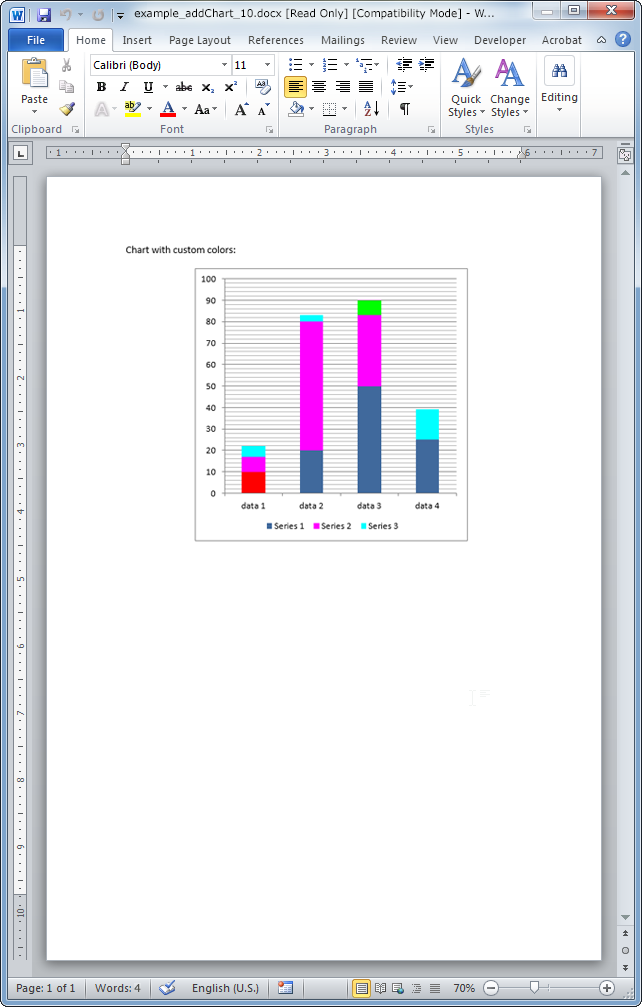
Example #4
The resulting Word document looks like:
- phpdocx 16.0:
- set custom title layout.
- apply font styles to series and values labels.
- phpdocx 15.5:
- serMarkerOptions option.
- throw Exception if there are no legends or values.
- extra check to avoid throwing an error when using a not supported theme chart option with combo charts.
- phpdocx 15.0:
- box & whisker, funnel, waterfall, histogram, sunburst and treemap chart types.
- deleteAxisValues and excludeExternalData options.
- phpdocx 14.0:
- avoid setting legend styles if the legend doesn't exist.
- phpdocx 13.5:
- position and valueDataLabels options.
- phpdocx 12.5:
- serDataLabels option.
- gapWidth and overlap options for bar and column chart types.
- close ZIP file using the externalXLSX option.
- phpdocx 12.0:
- htmlspecialchars applied in name, title, haxLabel and vaxLabel options.
- phpdocx 11.0:
- orientation and axPos options.
- formatCode option in pie and doughnut chart types.
- formatDataLabels option in pie chart types.
- add multiple series in scatter chart types.
- phpdocx 10.0:
- theme legends (bold, italic, size, underline) and grid lines (cap type, color, dash type, width) options.
- smooth option can be set as 0.
- phpdocx 9.5:
- theme chart options.
- supported custom legends in scatter chart types.
- phpdocx 9.0:
- improved performance: external files moved to an internal PHP structure.
- phpdocx 8.0:
- formatCode option.
- phpdocx 7.5:
- new data structure to allow repeating name values, trend lines, combo charts.
- charts can be edited when the DOCX is opened.
- majorUnit, minorUnit, scalingMax and scalingMin options in bar, col, line, area, radar and scatter chart types.
- smooth option in line and scatter chart types.
- styles for titles, show legend keys and series labels, format data labels in col and bar chart types (rotation and position).
- externalXLSX option.
- phpdocx 6.0:
- majorUnit and minorUnit options.