XML API - pdx:addChart

- addBackgroundImage
- addFooter
- addHeader
- addLineNumbering
- addMacroFromDoc
- addPageBorders
- addProperties
- addSection
- createCharacterStyle
- createListStyle
- createParagraphStyle
- docxSettings
- importHeadersAndFooters
- importListStyle
- importStyles
- modifyPageLayout
- parseStyles
- removeFooters
- removeHeaders
- setBackgroundColor
- setDefaultFont
- setDocumentDefaultStyles
- setEncodeUTF8
- setLanguage
- setMarkAsFinal
- addBookmark
- addBreak
- addChart
- addComment
- addCrossReference
- addDateAndHour
- addEndnote
- addExternalFile
- addFootnote
- addFormElement
- addHeading
- addImage
- addLink
- addList
- addMathEquation
- addMergeField
- addOnlineVideo
- addPageNumber
- addShape
- addSimpleField
- addStructuredDocumentTag
- addTable
- addTableContents
- addTableFigures
- addText
- addTextBox
- addWordML
- embedHTML
- clearBlocks
- deleteBlock
- modifyInputFields
- processTemplate
- rawSearchAndReplace
- removeTemplateVariable
- replaceListVariable
- replacePlaceholderImage
- replaceTableVariable
- replaceVariableByExternalFile
- replaceVariableByHtml
- replaceVariableByText
- replaceVariableByWordFragment
- replaceVariableByWordML
- setTemplateSymbol
- setTemplateBlockSymbol
pdx:addChart
Inserts a chart into a Word document.
Note
You are reading the XML API documentation. For the PHP API method please go to addChart.
Description
Element definition
This element allows the insertion of a chart into the Word document.
You may insert many different types of 2D and 3D charts:
- 2D
- Bar (clustered, stacked and 100% stacked).
- Column (clustered, stacked and 100% stacked).
- Doughnut.
- Line.
- Area.
- Surface.
- Radar.
- XY(scatter).
- Bubble.
- 3D
- Bar: box (default), cylinder, cone, and pyramid (clustered, stacked and 100% stacked).
- Column: box (default), cylinder, cone, and pyramid (clustered, stacked and 100% stacked).
- Pie (simple and exploded).
- Surface.
- Line.
Attributes and sub-elements
| Key | Description |
|---|---|
| chartType | The possible values are:
|
| title | The chart title (if any). |
| border | Border width in points. |
| color | Word color scheme for charts:
|
| chartAlign | Chart alignment: left (default), right or center. |
| externalXLSX | Possible attributes and values are:
|
| float | Floating chart: left, right or center. It only applies if textWrap is not inline (default value). |
| font | The font to be used. Arial, Calibri... |
| sizeX | The chart width in centimeters (default value aprox 8.5 cm). |
| sizeY | The chart height in centimeters (default value aprox 6.0 cm). |
| textWrap | The way text shoud wrap the chart. Possible values are (check in the Word interface for the graphical explanation of the different terms):
|
Chart display properties
| Key | Description |
|---|---|
| formatCode | Number format. |
| formatDataLabels | Possible attributes and values are:
|
| haxLabel | Label for the horizontal axis. |
| haxLabelDisplay | How to display the label of the horizontal axis. Possible values are: vertical, horizontal, rotated. |
| hgrid | Horizontal grid. Possible values are:
|
| horizontalOffset | Given in emus (1cm = 360000 emus). |
| majorUnit | Major unit value for bar, col, line, area, radar and scatter charts. |
| minorUnit | Minor unit value for bar, col, line, area, radar and scatter charts. |
| scalingMax | Scaling max value for bar, col, line, area, radar and scatter charts. |
| scalingMin | Scaling max value for bar, col, line, area, radar and scatter charts. |
| vaxLabel | Label for the vertical axis. |
| vaxLabelDisplay | How to display the label of the horizontal axis. Possible values are: vertical, horizontal, rotated. |
| verticalOffset | Given in emus (1cm = 360000 emus). |
| vgrid | Vertical grid. Possible values are:
|
The available parameters to display legends and data include:
| Key | Description |
|---|---|
| legendOverlay | If true the legend may overlay the chart. This option may hinder the legibility of tha data so it is only recommended if it is crucial to "save space". |
| legendPos | The possible values are:
|
| showCategory | If true shows the categories inside the chart. |
| showLegendKey | If true shows the legend values. |
| showPercent | If true shows the percentage values. |
| showSeries | If true shows the series values. |
| showTable | If true shows the chart data in an associated table. |
| showValue | If true shows the chart data values. |
Further configuration options for specific chart types are:
| Key | Description |
|---|---|
| Bar and column charts | |
| groupBar | Different ways to group the data. Possible values are: clustered, stacked, percentStacked and standard. |
| tickLblPos | Tick label position. |
| Pie and doughnut charts | |
| explosion | Distance among different sectors. |
| holeSize | Size of the inner hole (only doughnut charts). |
| ofPieCharts: pie of pie and bar of pie charts | |
| custSplit | Custom split. Array (zero based) of values that go in the second chart. For example: array(3,4,7) will pick the fourth, fifth and eighth value. |
| gapWidth | Distance between the two charts. |
| secondPieSize | Percentage size of the auxiliary chart. |
| splitPos | Determines the threshold value to split the charts. |
| splitType | How to split the two charts. Possible values are:
|
| subtype | Defines if the auxiliary chart is a pie or bar chart. Possible values are pie or bar. |
| Line and scatter (XY) charts. | |
| smooth | If true it smooths the line (only scatter charts) |
| symbol | The possible symbol values:
|
| symbolSize | The size of the symbol used. |
| Radar charts. | |
| style | Defines the radar chart style. Possible values are:
|
| Surface charts | |
| wireframe | If true the surface is shown as a wireframe. |
Additional available options for 3D charts:
| Key | Description |
|---|---|
| perspective | Perspective angle. Angles beyond 25 degrees provoke a big distortion in the 3D chart representation. |
| rotX | Rotation angle respect the vertical axis. Standard values are between 10 and 20 degrees. |
| rotY | Rotation angle respect the horizontal axis. Standard values are between 10 and 20 degrees. |
Theme options (Only available in Premium linceses):
| key | Description |
|---|---|
| chartArea | backgroundColor |
| gridLines | capType, color, dashType, width |
| horizontalAxis | textBold, textDirection (horizontal, rotate90, rotate270), textItalic, textSize, textUnderline (DrawingML values such as none, sng, dash) |
| legendArea | backgroundColor, textBold, textItalic, textSize, textUnderline |
| plotArea | backgroundColor |
| serRgbColors | series colors |
| valueRgbColors | values colors |
| verticalAxis | textBold, textDirection (horizontal, rotate90, rotate270), textItalic, textSize, textUnderline (DrawingML values such as none, sng, dash) |
Code samples
Example #1
config.xml
content.xml
settings.xml
PHP code
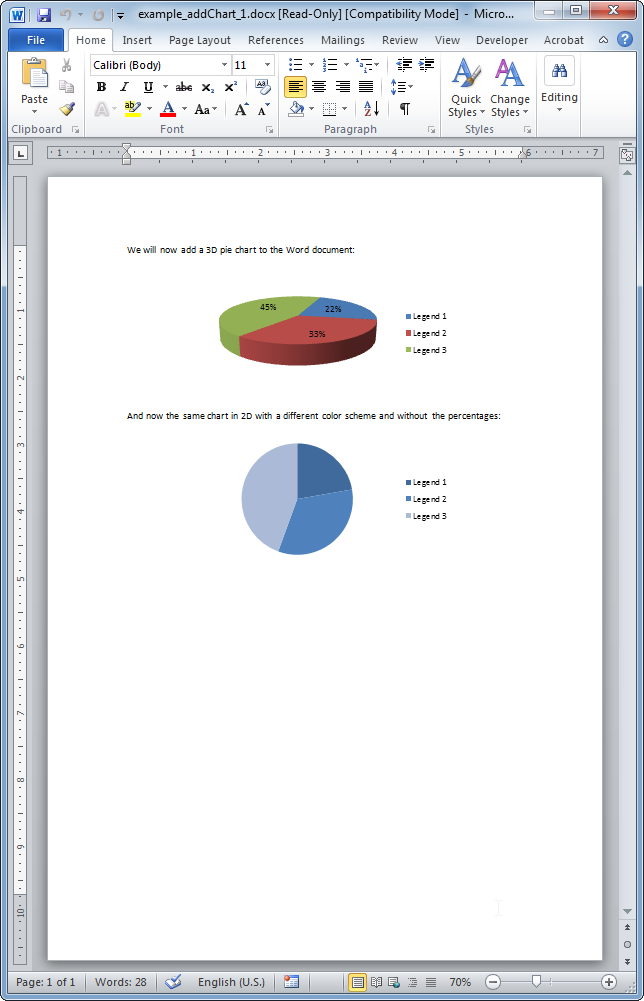
The resulting Word document looks like: